Reports
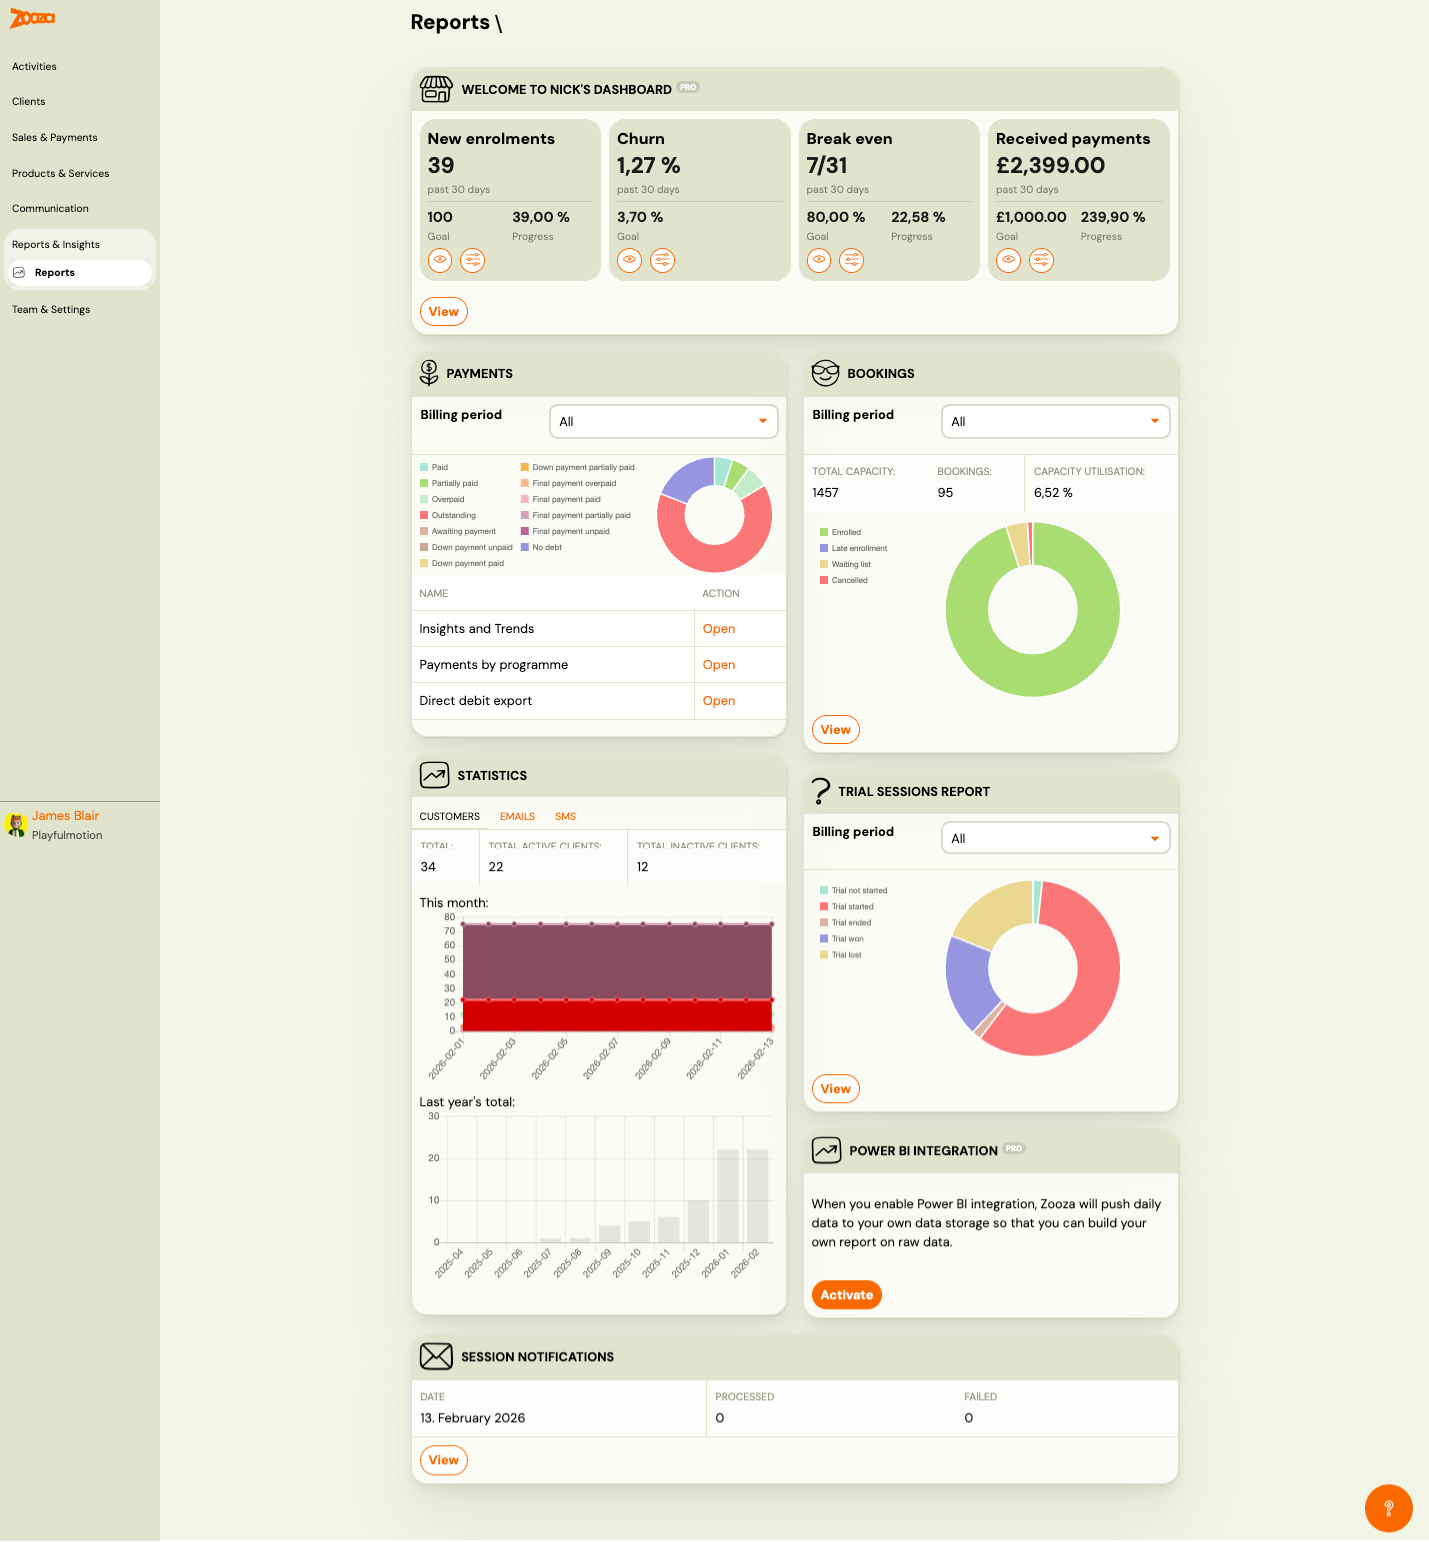
The Reports screen provides an overview of your business metrics, payment status, booking occupancy, client statistics, trial conversion, and session notifications. It includes a personalizable dashboard with goal tracking powered by Nick's Dashboard.
Navigation: Go to Reports & Insights → Reports.
The figure you want is not on any of these screens? Ask Zooza AI instead — connect Claude or ChatGPT to your account and ask in plain language ("what has each trainer been paid this term", "payments by programme since we opened"). It reads your real data, within your own permissions, and answers questions no fixed report covers.
The chat bubble inside Zooza cannot do this. That one answers from the help documentation only — it has no access to your account, so it cannot tell you who has not paid or how full Monday is. Two different things with two different jobs: see what each one can do.
Nick's Dashboard
A personalizable dashboard with four key business metrics tracked over the past 30 days:
| Metric | Description |
|---|---|
| New enrolments | Number of genuinely new and first-time paying clients who booked onto your programme, not including returning clients or children who came for a free trial. |
| Churn | Percentage of clients who did not re-enrol. |
| Break even | Progress toward your break-even point (e.g. "7/31"). |
| Received payments | Total payments received in the period. |
Each metric card shows:
- Current value (past 30 days)
- Goal value
- Progress percentage
- Eye icon (view detail) and settings icon (configure)
Button: View — opens the detailed dashboard with per-programme drill-down.
Dashboard Detail
Navigation: Reports → Nick's Dashboard → View.
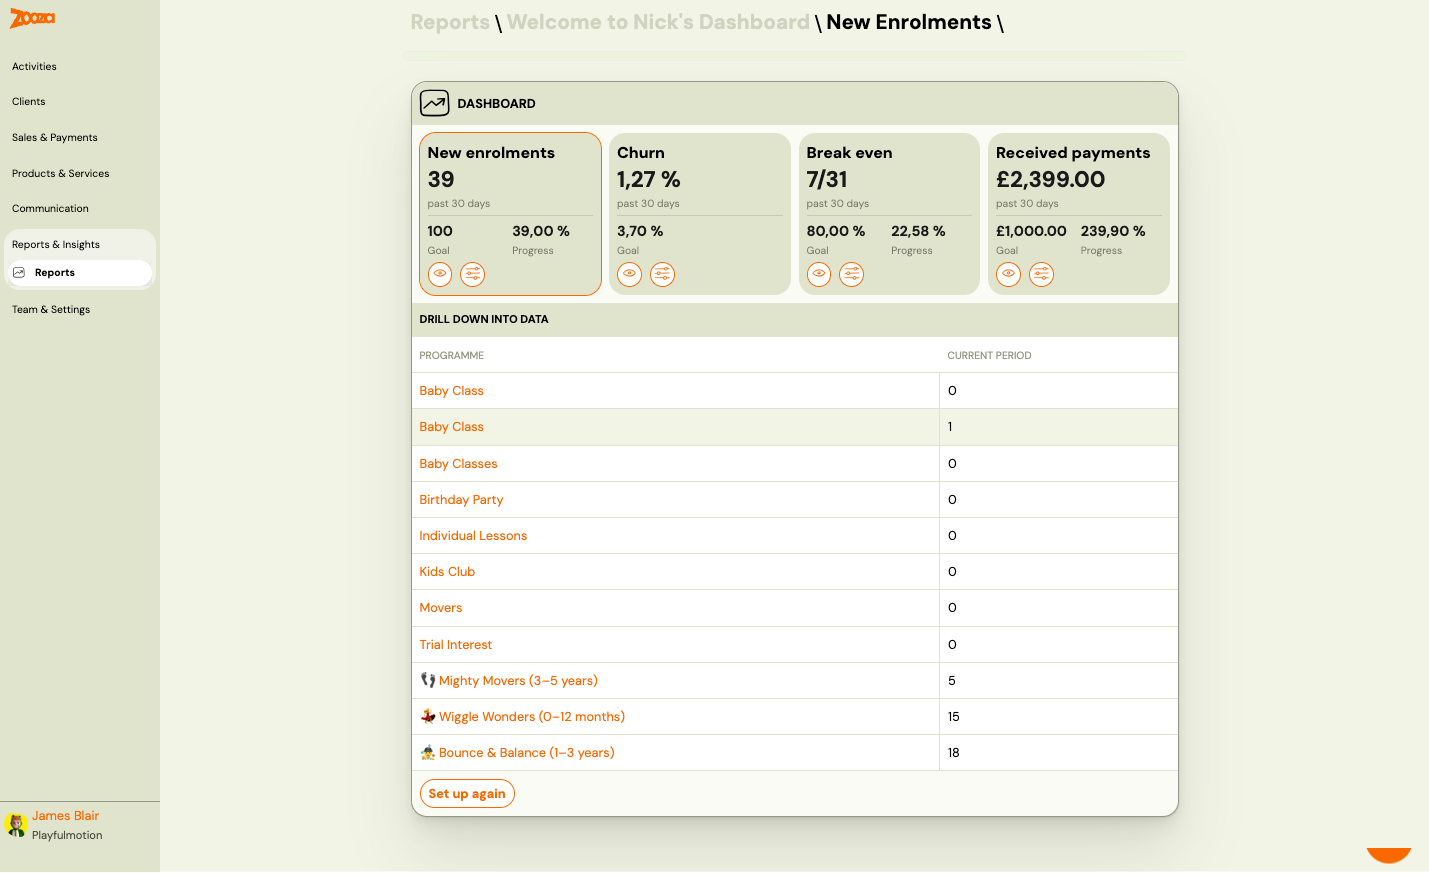
The detail view shows:
- All four metric cards at the top
- Drill down into data — a table listing each programme with its current period value
| Column | Description |
|---|---|
Programme | Programme name (clickable link). |
Current period | Metric value for the current period. |
Button: Set up again — re-run the quick setup wizard.
Quick Setup
Navigation: First visit to Reports, or click Set up again.
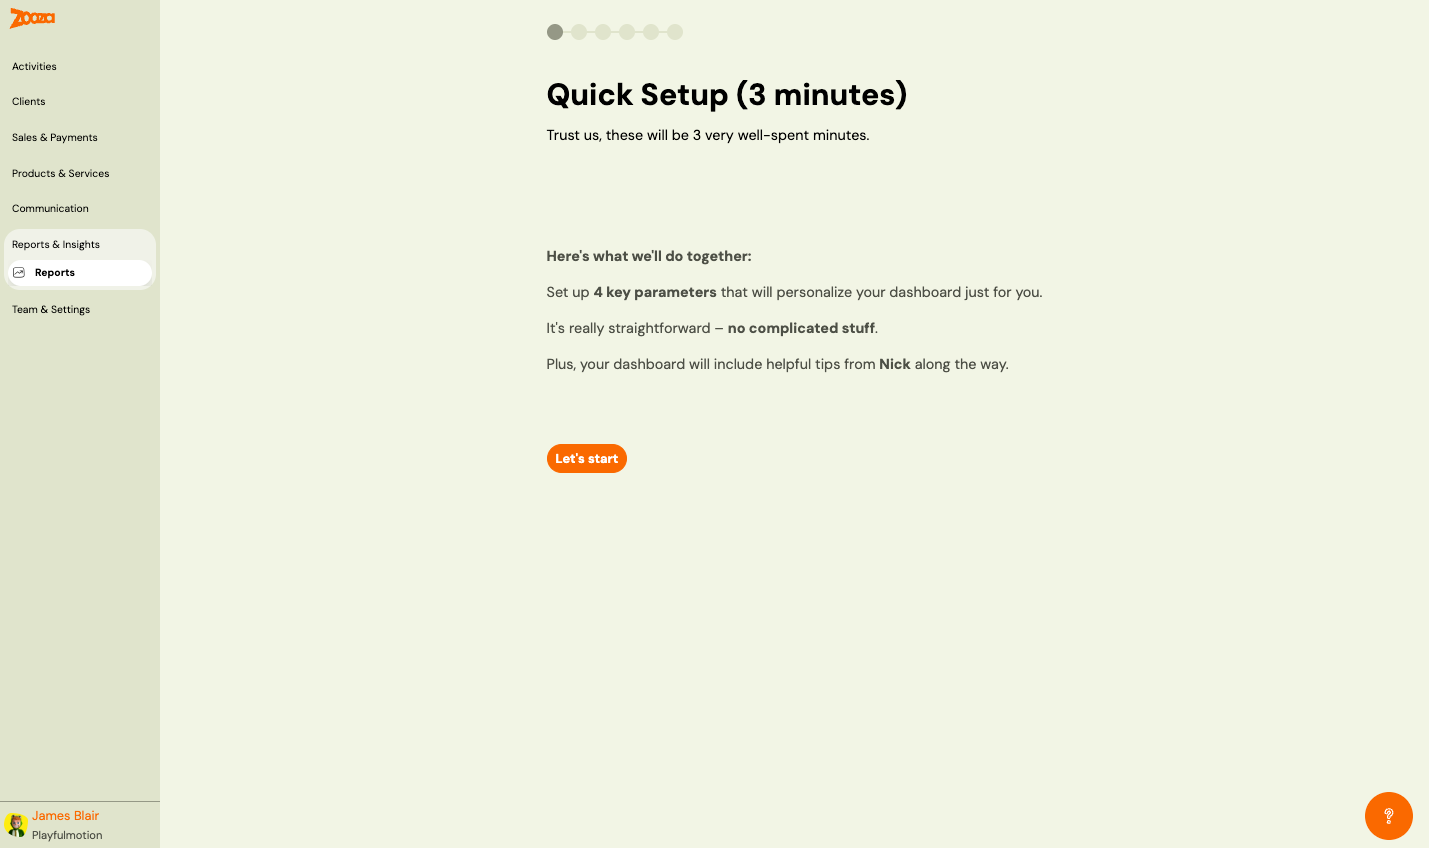
A 6-step wizard to personalize your dashboard. Set up 4 key parameters:
- New Enrolments — select which programme to track and set a monthly target goal.
- Churn — configure churn tracking parameters.
- Break Even — set your break-even targets.
- Received Payments — set payment goals.
Each step shows the metric explanation with tips from Nick Empson (Education franchise expert) and a Learn more about this growth metric link.
Payments
A summary of payment status for a selected billing period.
| Field | Description |
|---|---|
Billing period | Dropdown to select the period (e.g. "All"). |
A donut chart visualizes payment status with the following categories:
- Paid, Partially paid, Overpaid, Outstanding, Awaiting payment, Down payment unpaid, Down payment partially paid, Final payment overpaid, Final payment paid, Final payment partially paid, Final payment unpaid, No debt
Payment Reports
| Report | Description |
|---|---|
| Insights and Trends | Booking and payment trends over time (see Payments Reference). |
| Payments by programme | Income breakdown per programme (see Payments Reference). |
| Direct debit export | Export direct debit data (see Payments Reference). |
| Refunds | Date-filterable list of all refunds, exportable to XLSX. See Refunds report below. |
Bookings
Booking occupancy overview for a selected billing period.
| Field | Description |
|---|---|
Billing period | Dropdown to select the period. |
Total capacity | Total available spots across all classes. |
Bookings | Number of active bookings. |
Capacity utilisation | Percentage of capacity filled. |
A donut chart shows the breakdown by booking status:
- Enrolled (green)
- Late enrolment (blue)
- Waiting list (yellow)
- Cancelled (red)
Button: View — opens detailed booking report.
Statistics
Client and communication statistics with three tabs:
Clients
| Metric | Description |
|---|---|
Total | Total number of registered clients. |
Total active clients | Clients with at least one active booking. |
Total inactive clients | Clients with no active bookings. |
Two bar charts show:
- This month — daily client activity for the current month.
- Last year's total — monthly client totals for the past 12 months.
Emails
Email sending statistics (tab).
SMS
SMS sending statistics (tab).
Trial Sessions Report
A summary of trial session outcomes for a selected billing period.
| Field | Description |
|---|---|
Billing period | Dropdown to select the period. |
A donut chart shows trial statuses:
- Trial not started
- Trial started (red)
- Trial ended (purple)
- Trial won (green)
- Trial lost (beige)
Button: View — opens the Trial Sessions Report detail.
Trial Sessions Report Detail
Navigation: Reports → Trial Sessions Report → View.
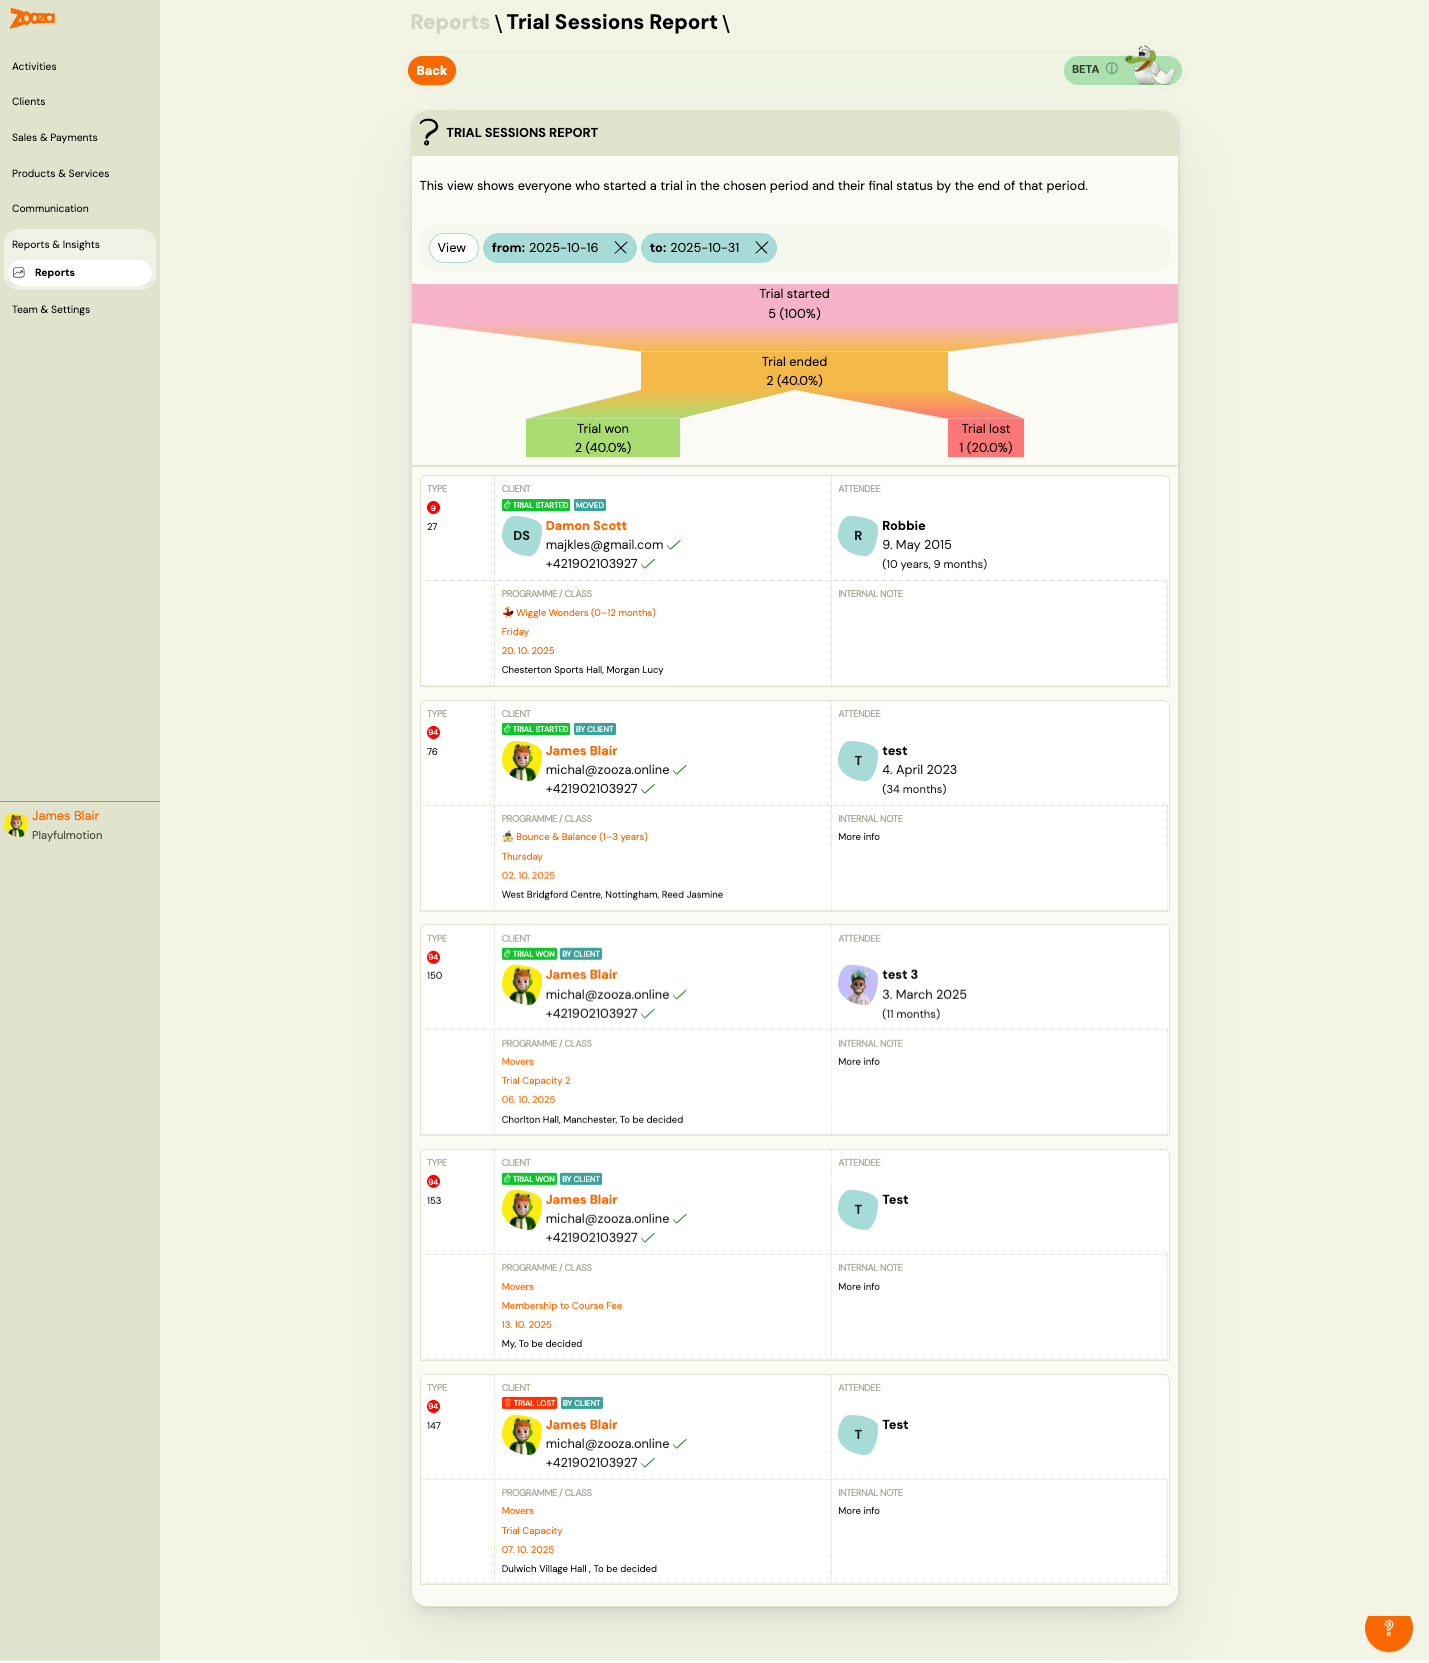
Note: This feature is currently in beta.
Shows everyone who started a trial in the chosen period and their final status by the end of that period.
Filters
- View button with date range filters (from and to).
Funnel Visualization
A visual funnel showing the conversion flow:
- Trial started → Trial ended → Trial won / Trial lost
Each stage shows count and percentage.
Trial List
Each trial card shows:
| Field | Description |
|---|---|
Type | Booking number with status badges (e.g. "Trial Started", "Moved", "By Client", "Trial Won", "Trial Lost"). |
Client | Client name, avatar, email, and phone (with verification ticks). |
Attendee | Child name, date of birth, and age. |
Programme / Class | Programme name, class name, date, and location. |
Internal note | Notes added by staff. |
Power BI Integration
When enabled, Zooza pushes daily data to your own data storage so you can build custom reports on raw data.
Button: Activate — enable the Power BI integration.
Session Notifications
Navigation: Reports → Session Notifications → View.
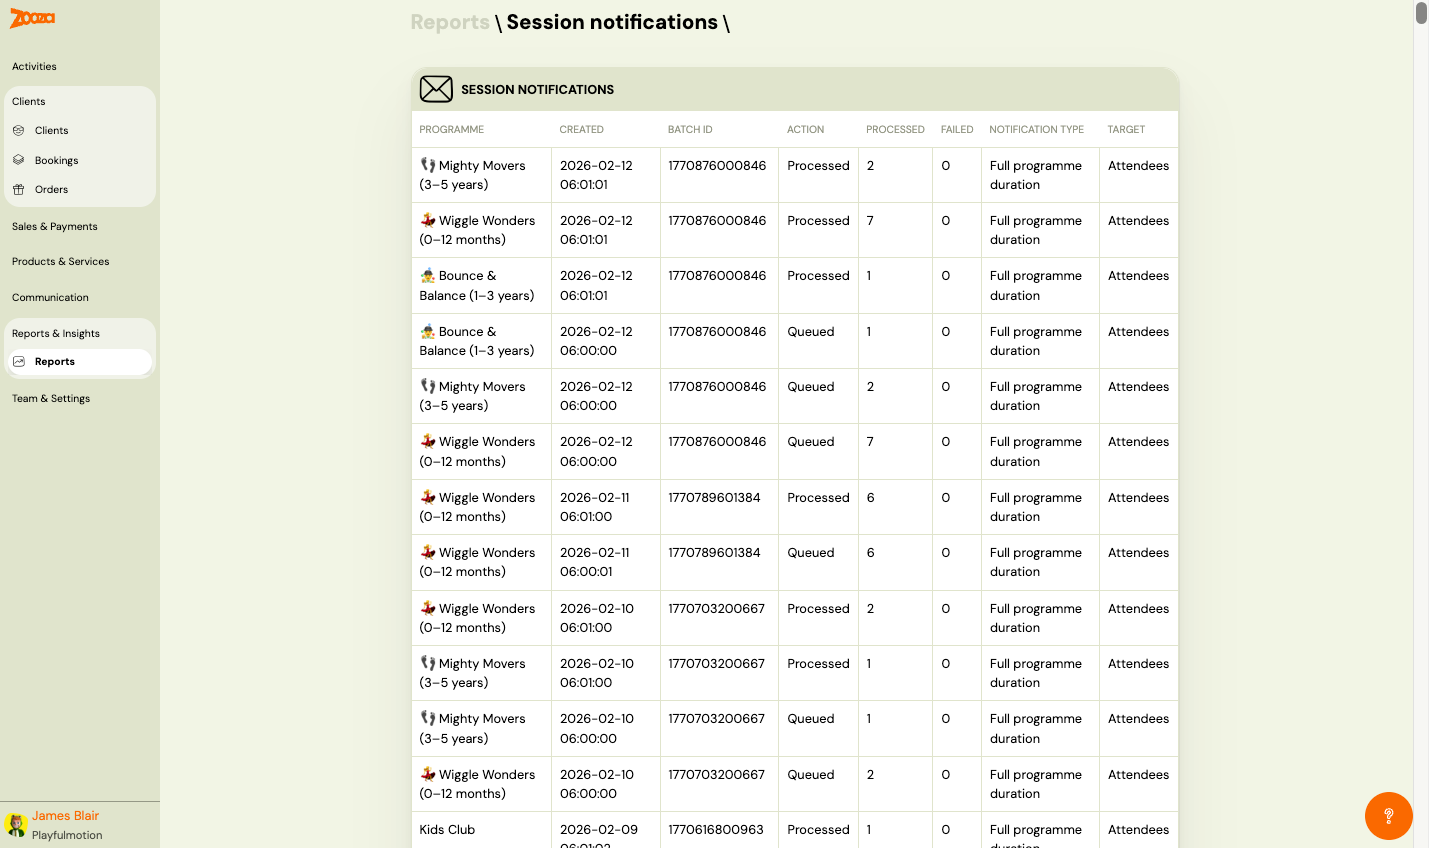
A log of automated session notification emails sent to clients.
| Column | Description |
|---|---|
Programme | Programme name with icon. |
Created | Timestamp of notification creation. |
Batch ID | Internal batch identifier. |
Action | Processing status — "Processed" or "Queued". |
Processed | Number of notifications processed. |
Failed | Number of failed notifications. |
Notification type | Type — e.g. "Full programme duration". |
Target | Target audience — e.g. "Attendees". |
The dashboard card shows the latest date with processed and failed counts.
Asking is often quicker than finding the right report. Zooza AI can answer questions across your data directly — who has not paid in a class, how many trials converted last term, which sessions are under-filled — without you working out which report holds it. It reads with your own permissions, so it can only see what your role can.
Refunds Report
Permission required: Owner role
Navigation: Go to Payments → Reports → Refunds.
A date-filterable list of all refunds — the outbound mirror of the received-payments list. Use it for monthly reconciliation and accounting: "how much did we refund in June, and to whom?"
Filters
| Filter | Description |
|---|---|
From / To | Date range filter on the refund value date. |
Report columns
Always visible:
| Column | Description |
|---|---|
Date | Value date and posting date of the refund. |
Amount | Refund amount (always shown as a negative value, e.g. −€30). |
Currency | Payment currency. |
Client | Client name and email linked to the refund. |
Reference | Booking or order the refund relates to. |
Note | Admin note attached to the refund (if any). |
Status | Processing status (e.g. Pending, Completed). |
Additional columns visible on Export only (blank for older or manually-recorded refunds):
| Column | Description |
|---|---|
Payment method | Original payment method (card, bank transfer, etc.). |
Refund type | Full or partial. |
Source | Gateway-initiated or administrative. |
Provider refund ID | Reference from the payment gateway (e.g. Stripe). |
Issued by | Admin who issued the refund. |
Export
Click Export to download the full column set as XLSX. The export follows the same download mechanism as the Inbound payments export.
Note: Older refunds recorded manually (before the refund gateway flow was introduced) appear in the on-screen list but some of the enrichment columns will be blank. This is expected — every refund is included; only the gateway metadata is missing for historical entries.
Disrupted Sessions Report
Permission required: Owner role
Navigation: Go to Reports & Insights → Reports → Sessions → Rescheduled, Substituted, or Cancelled.
Shows which clients were affected by rescheduled, substituted, or cancelled sessions — one row per (booking × disrupted session). Use it to answer questions like "which clients had their May sessions rescheduled?" or to export a contact list after a batch of cancellations.
The three views (Rescheduled, Substituted, Cancelled) share the same layout and filters; each is accessed from the Sessions group in the Reports sidebar.
Shortcut from Calendar: The Calendar action toolbar also has direct Make-up sessions, Rescheduled, and Substituted buttons to jump to the corresponding report.
Filters
| Filter | Description |
|---|---|
Date range | The period to report on (applies to the disrupted session date). |
Programme | Narrow to a specific programme. |
Class | Narrow to a specific class. |
Instructor | Filter by the instructor originally assigned to the session. |
Location | Filter by venue. |
Billing period | Align with a billing period. |
Client | Search by client name or email. |
Day | Filter by day of week. |
Report columns
| Column | Description |
|---|---|
Date | Session date (rescheduled/cancelled date). For rescheduled sessions, the original date is shown as a subtitle. For substituted sessions, the original and substitute instructor are shown. |
Programme / Class | Programme name and class name (both clickable links). |
Attendee | The person who attended (may differ from the account holder if the booking is for a child). |
Client (Buyer) | The account holder (booking owner), with name and email. |
Attendance | The recorded attendance state for that session (attended, no-show, cancelled, etc.). |
Export
Click Export to download the filtered result as XLSX.
Common tasks
How to export a list of active clients with contacts
Clients and registrations are two different things in Zooza — this is the most common source of confusion when exporting.
| What you want | Where to export from |
|---|---|
| List of clients (one row per person) with name, email, phone | Clients → Export |
| List of registrations (one row per booking, may include one client multiple times) | Bookings → Export |
To export active clients with contact details:
- Go to Clients.
- Use the filters to narrow down if needed (e.g. by programme or status).
- Click Export — the CSV includes name, email, phone, and other client fields.
If a client has two children enrolled, you will see them once in the Clients export but twice in the Bookings export. This explains why the two counts often differ.
Why do the numbers in reports differ from my manual count?
Reports calculate figures based on status filters and billing period — changing either will give a different result. Common reasons for discrepancies:
| Situation | Explanation |
|---|---|
| Report shows fewer clients than the Clients list | Report is scoped to one billing period; Clients list shows all time |
| Bookings count is higher than client count | One client can have multiple bookings (different classes or terms) |
| Active bookings in report ≠ active bookings in list | Report may exclude waiting-list or trial bookings; check the status filter |
| Payment totals don't add up | Some payments may be in a different billing period or status (Partially paid, etc.) |
When numbers don't match, the fastest fix is to check which billing period and status filters are active in each view and align them.
Related
- Payments Reference — detailed payment reports.
- Sessions List — filter and export individual sessions.
- Dashboard Reference — admin home screen.